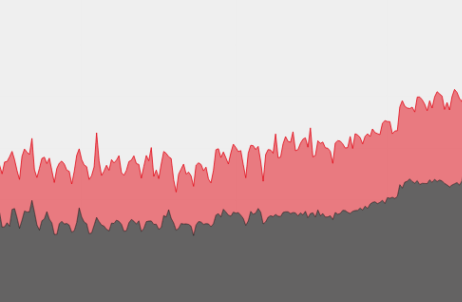
In March, the TOP-IX Consortium produced a weekly report on the trend of Internet traffic exchanged on its TOP-IX infrastructure, in the days of the lockdown. Those data are now made available on a dedicated page of the site, which shows the aggregation of all TOP-IX’s switches and remote sites.
Four graphs show the daily, weekly, monthly and yearly exchanged traffic and allows to explore details on daily maximum values. The daily focus shows the daily trend of connections. Usually, the peak occurs between 9 pm and 10,30 pm and there are no particular differences between weekdays and holidays. The monthly graph highlights the peack recorded on April 8 (170.68 Gbps) and the fact that traffic stabilized at much higher values than those pre Covid-19. In the annual chart, we can clearly see the increase in traffic since 23 February and the further acceleration after 8 April.


